At Bar Harbor Bank & Trust, we value a diverse workforce to ensure different perspectives and ideas are considered and integrated into our operations. Ensuring that we are always recruiting, retaining, and promoting a diverse mix of colleagues that represents the diversity in our local communities gives us access to a broad range of ideas and perspectives. This allows us to be a better company and to provide products and services that exceed our customers’ expectations. See below for additional information.
Gender and Racial Diversity at a Glance
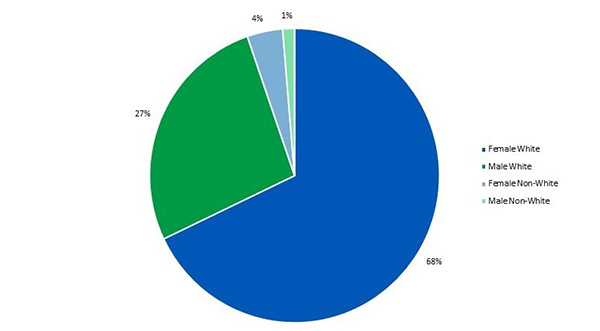
At a glance, Bar Harbor Bank & Trust possesses strong gender diversity in its workforce. This pie chart illustrates that 68% of employees are white females, 27% are white males, 4% are non-white females, and 1% are non-white males.
Gender Representation in Leadership
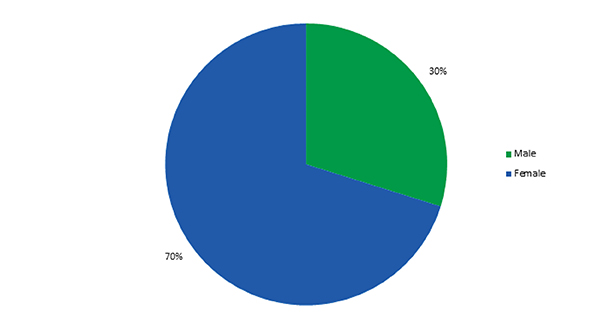
Bar Harbor Bank & Trust values gender representation in its leadership team. This pie chart shows that 70% of the leadership team is female, while 30% is male.
Racial Diversity Compared to Footprint
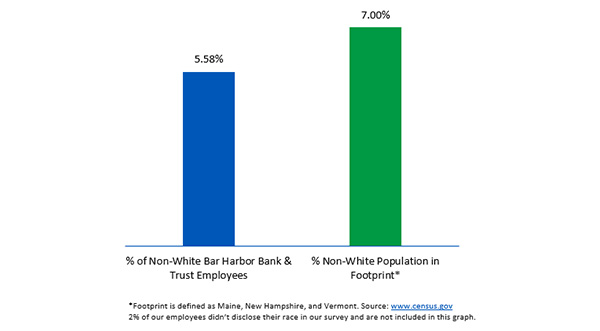
Compared to the footprint population, the Bar Harbor Bank & Trust’s employees have a similar diversity. This bar chart illustrates that 5.58% of Bar Harbor Bank & Trust employees are non-white, while 7.0% of the entire footprint population is non-white.
Detailed Racial Diversity Information
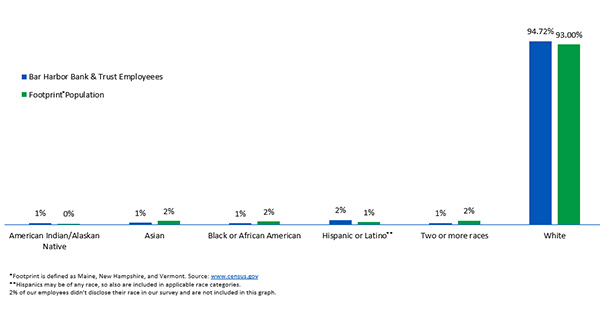
Bar Harbor Bank & Trust employees possess a similar representation of races and ethnicities when compared to the footprint population. This bar chart shows that 1% of employees are Black or African American and 2% of the footprint population is Black or African American. 2% of employees are Hispanic or Latino and 1% of the footprint population is Hispanic or Latino. 1% of employees are two or more races and 2% of the footprint population is two or more races. 94.72% of employees are White and 93% of the footprint population is white. 1% of employees and 0% of the footprint population is American Indian/Alaskan Nation or Native Hawaiian or other Pacific Islander. 1% of employees are Asian and 2% of the footprint population is Asian.